When developing with ESPHome on ESP32 devices, crashes can be frustrating to debug without proper stack traces. Enabling coredumps provides detailed crash information to help identify the root cause of issues.
Configuration
To enable coredump functionality, you’ll need to modify your ESPHome configuration and create a custom partition table. This setup is for the Arduino framework - ESP-IDF configurations will differ slightly.
ESPHome Configuration
Add the following to your ESPHome YAML configuration:
esp32:
  framework:
    type: arduino
  # Partitions file seems to require full path
  partitions: /full/path/to/custom_partitions_core_dump.csv

esphome:
  platformio_options:
    build_flags:
      - -DCONFIG_ESP_COREDUMP_ENABLE_TO_FLASH=y
      - -DCONFIG_ESP32_COREDUMP_DATA_FORMAT_ELF=y
      - -DCONFIG_ESP32_COREDUMP_CHECKSUM_CRC32=y

# Optional: Button to trigger test crashes
button:
  - platform: template
    name: "Test Crash"
    id: crash_button
    on_press:
      then:
        - lambda: |-
            ESP_LOGE("test", "Crashing device intentionally!");
            int* p = nullptr;
            *p = 42;
Custom Partition Table
Create a custom partition table file (custom_partitions_core_dump.csv). This is an example for an ESP32 with 8MB flash:
# Name,   Type, SubType,  Offset,   Size,     Flags
nvs,      data, nvs,      0x9000,   0x5000,
otadata,  data, ota,      0xE000,   0x2000,
app0,     app,  ota_0,    0x10000,  0x3C0000,
app1,     app,  ota_1,    0x3D0000, 0x3C0000,
eeprom,   data, 0x99,     0x790000, 0x1000,
coredump, data, coredump, 0x791000, 0x10000,
spiffs,   data, spiffs,   0x7A1000, 0x5F000
The key addition is the coredump partition which reserves 64KB (0x10000) of flash storage for crash dumps.
Extracting Coredumps
When a crash occurs, the ESP32 will write the coredump to the dedicated partition. To analyze it:
Copy the firmware ELF file (needed for symbol resolution):
cp .esphome/build/your-device/.pioenvs/your-device/firmware.elf firmware.elfExtract and analyze the coredump:
esp-coredump --port /dev/ttyACM0 info_corefile --save-core=my_core_dump.bin --core-format=raw firmware.elf > coredump.txtSave coredump for offline analysis:
# Extract raw coredump from flash
esptool.py --port /dev/ttyACM0 read_flash 0x791000 0x10000 coredump.bin

# Erase the coredump partition for next crash
esptool.py --port /dev/ttyACM0 erase_region 0x791000 0x10000

# Analyze offline
esp-coredump info_corefile --core coredump.bin --core-format=raw firmware.elf
Installing ESP-IDF Tools
The esp-coredump tool is part of the ESP-IDF framework. Install it by cloning the ESP-IDF repository:
git clone --depth 1 --recursive https://github.com/espressif/esp-idf.git
cd esp-idf
./install.sh

# run this every time to add the esp-idf tools to your PATH
. ./export.sh
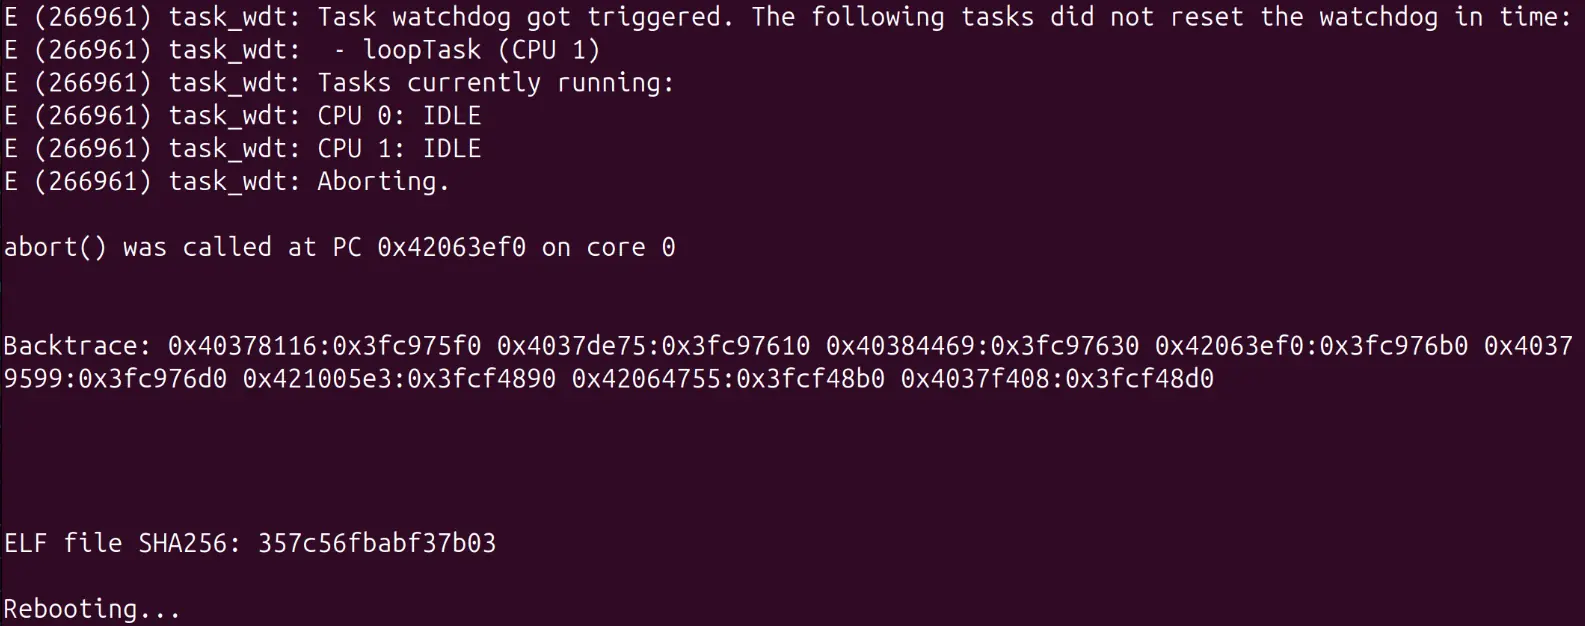
Online Stack Trace Decoder
For quick analysis without local ESP-IDF installation, use the ESPHome Stack Trace Decoder web tool. Simply paste your stack trace and firmware ELF file to get decoded function names and line numbers.
Summary
Coredump debugging significantly improves the development experience when working with ESPHome on ESP32 devices. The detailed crash information helps identify issues that would otherwise require extensive trial-and-error debugging. Once configured, coredumps are automatically generated on each crash, overwriting the previous dump.