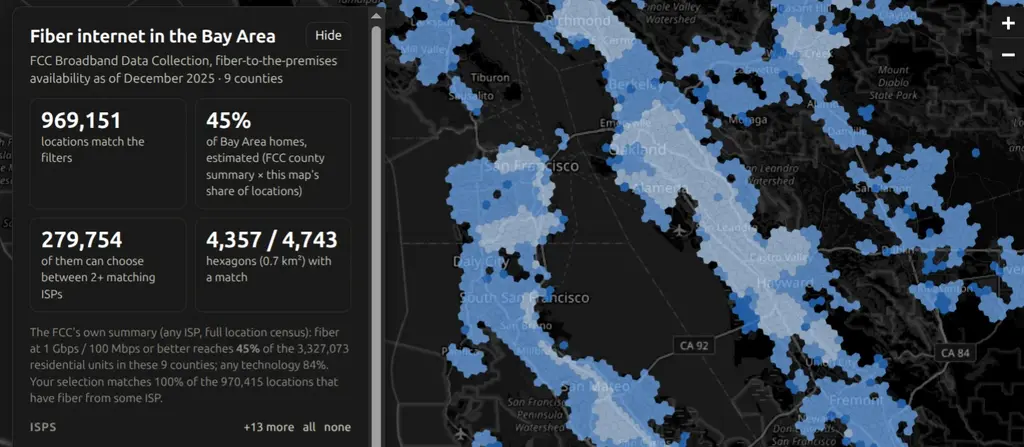
Bay Area Fiber Map showing fiber availability hexagons across the Bay Area

Bay Area Fiber Map

An interactive map of where fiber-to-the-premises internet is available across the nine Bay Area counties, built from the FCC’s Broadband Data Collection (the data behind the National Broadband Map). It includes every ISP that files fiber availability with the FCC (AT&T, Sonic, Comcast/Xfinity, Astound, and more), and can be filtered by ISP, minimum advertised download speed, and residential vs business locations. The map has three levels of detail depending on zoom: H3 hexagons for the whole region, 2020 census blocks, and individual building footprints from DataSF and Overture Maps. Areas can be colored by fastest available speed or by how many ISPs serve them, which makes it easy to see where there is actual competition. Clicking an area shows every ISP present, their advertised speeds, whether they reach all or only some of the locations, and a link to the same spot on the FCC’s map. ...
October 15, 2026 · 1 min · Ian Foster
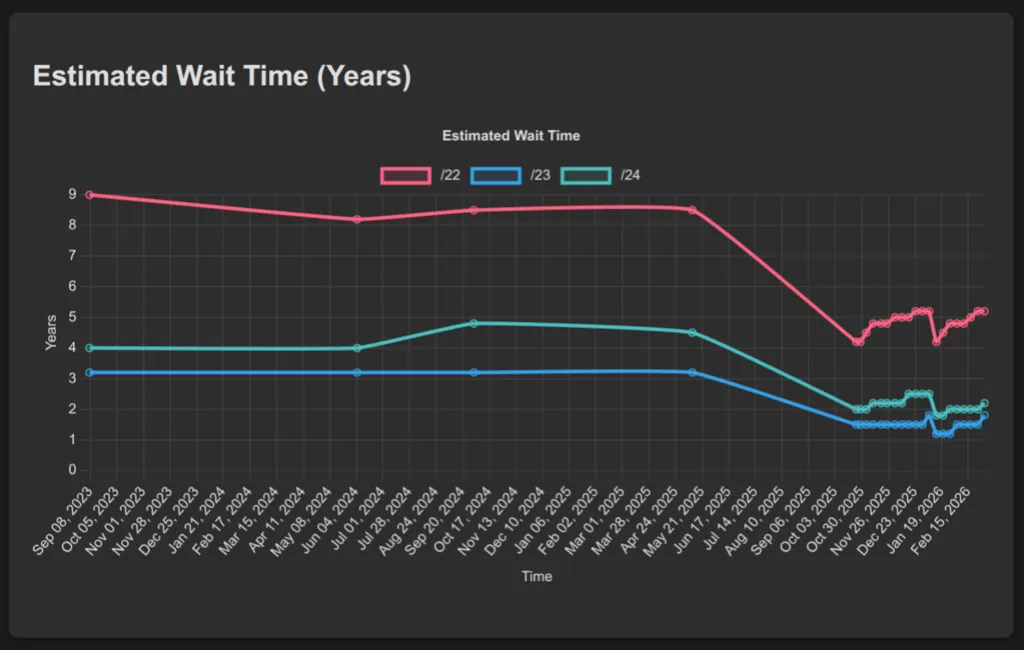
ARIN IPv4 Waitlist Tracking dashboard

ARIN IPv4 Waitlist Tracking

ARIN IPv4 Wait-list Tracking analyzes ARIN’s IPv4 address wait-list and provides statistical insights into wait times and allocation patterns. The Python-based system tracks historical data on IPv4 block requests and clearances to estimate processing times for different network block sizes. The web dashboard displays real-time analytics including current wait-list sizes, estimated wait times for /22, /23, and /24 blocks, and historical trends in IPv4 address allocation. This tool helps network administrators understand IPv4 scarcity patterns and plan address allocation strategies as IPv4 exhaustion continues.

September 20, 2025 · 1 min · Ian Foster
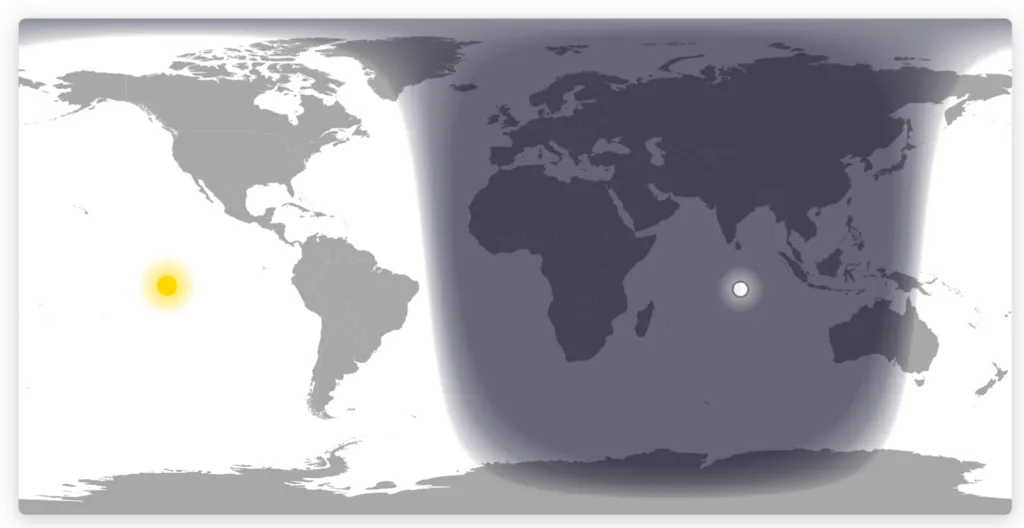
Day Night Map visualization

Day Night Map

A real-time visualization of day and night regions across the world using accurate solar and lunar positioning calculations. The project renders day/night terminator lines, solar and lunar positions, and smooth twilight gradients on an interactive world map using HTML5 Canvas. The visualization integrates the SunCalc library for astronomical calculations and features optimized pixel-level rendering with support for multiple map projections (Equirectangular and Mercator). Additional features include moon phase visualization, responsive design, timezone customization, and a grayscale mode optimized for e-ink displays. The map updates every minute to reflect current celestial conditions.

July 27, 2025 · 1 min · Ian Foster